Estimating Shot Speeds for Goals
Introduction
One thing I started noticing in recent years is broadcasts sometimes will show how fast some shots are when a goal is scored. For example:
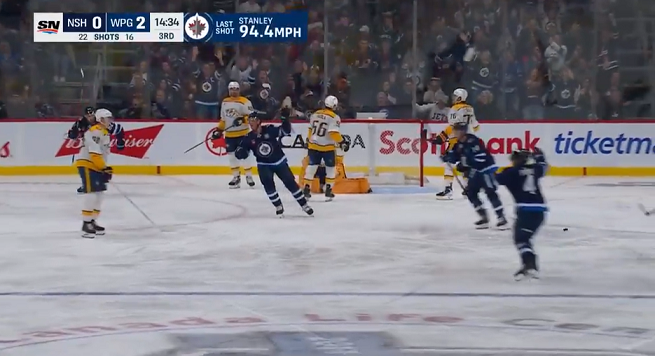
That made me want to find out the shot speeds for all goals. Since tracking data is publicly available for goals, that is possible.
The code for the analysis can be found here.
Data
In addition to the goal tracking data for the 2025-2026 regular season, I used shot location information from the NHL.com API. Specifically, I used the play-by-play endpoint:
https://api-web.nhle.com/v1/gamecenter/<game id>/play-by-play
The API provides shot locations in a different coordinate system than the one used by the tracking data, so I converted from the API’s coordinate system to the tracking one for this analysis.
Pre-Processing the Data
To find the original shot location for the goals, I tweaked the logic I had used for my lateral puck movement analysis. For non-deflection goals I found the spot in the tracking data that’s closest to the shot location given by the play-by-play API. For deflection goals I worked backward from the deflection location until the puck’s trajectory changed speed or direction above certain thresholds.
Speed Estimation
The tracking data provides information about where the puck is at each timestep. However, in order to figure out the speed at which the puck moves, I needed to know how much time is between each timestep. Luckily, since broadcasts will sometimes show the shot speed for some goals, I can use that to estimate the time between timesteps.
So I looked at the highlights of a few dozen slapshot goals, using the shot type information from the play-by-play API. I guessed that broadcasts would show the shot speed more often for slapshots. After checking out those highlights, I had the shot speeds for about a dozen goals.
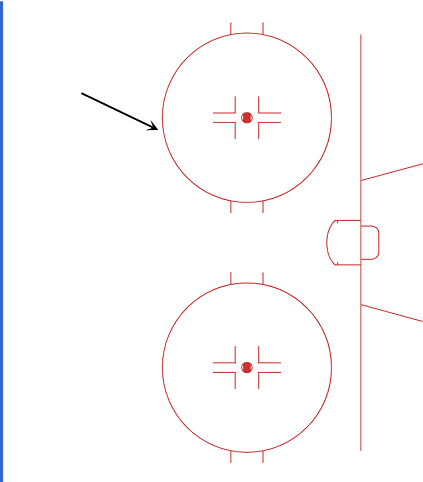
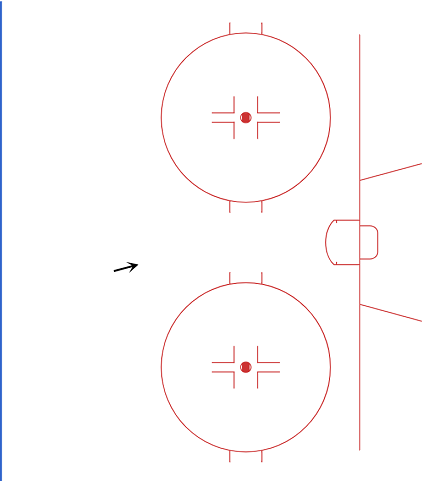
Combining the known shot speeds with the distance the puck traveled from the tracking data, I was able to estimate that each time interval between timesteps is about 0.1 seconds. With that information, I could then calculate the shot speed for all goals.
When calculating shot speeds, I used the speed in the time interval right after the shot to avoid complications with deflections. That gave me the speed in feet per second, which I then converted to miles per hour.
Here is an example of the part of the tracking data used to estimate shot speed:
And here is one for a slower shot:
Results
Below is a histogram of the shot speeds for all non-empty net goals in the 2025-2026 regular season:
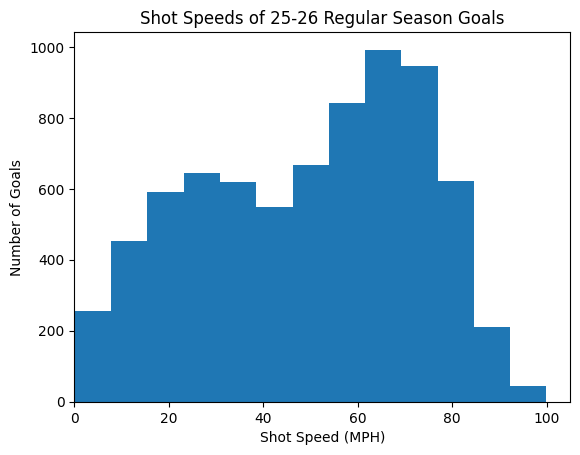
There is a small peak at around 30 mph and then a larger peak at around 70 mph.
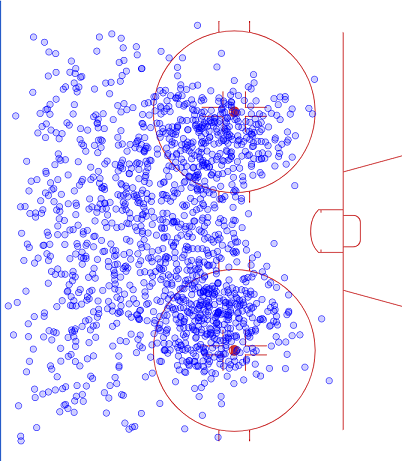
Additionally, I plotted the goal locations for each quintile of shot speeds. Each circle represents one goal. Goal locations for the first quintile (0-25 mph) are shown below:
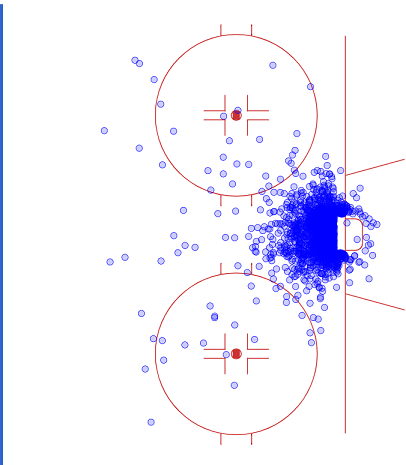
Second quintile (25-44 mph):
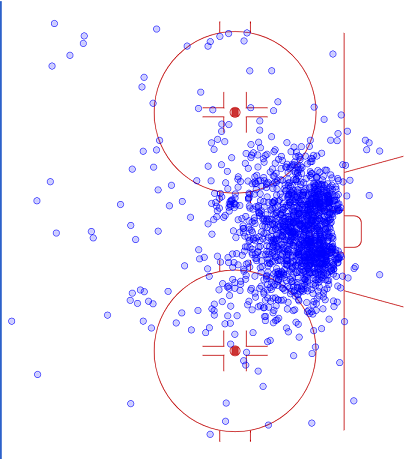
Third quintile (44-60 mph):
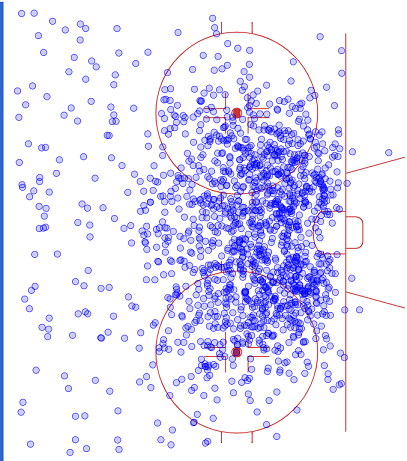
Fourth quintile (60-72 mph):
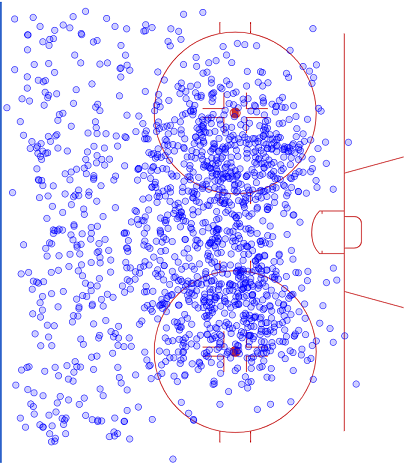
Fifth quintile (72-100 mph):
Conclusion
Faster shots coming from further out is not surprising.
Also, having a lot of goals with speeds of around 30 mph and having another bigger peak at around 70 mph makes sense with a lot of goals coming near the net and then a lot of goals coming from further out.
One potential thing to explore in the future is breaking down shot speeds by individual players.