Estimating Lateral Puck Movement Before Goals
Introduction
Moving the puck from one side of the other gets the goalie moving and can make it easier to score. So I wanted to see how much lateral puck movement there is right before a goal. To do so, I used both goal tracking data and shot location data from NHL.com’s API. Combining the two, I was able to isolate the parts of the tracking data right before the shot.
The code for the analysis can be found here.
Data
One part of the data I used was the goal tracking data. I used this data previously when clustering power play goals and when coming up with criteria for rush goals. The tracking data comes from NHL.com’s goal visualizations.
The other data I used was the shot location data provided by NHL.com’s API. Specifically, I used the play-by-play endpoint:
https://api-web.nhle.com/v1/gamecenter/<game id>/play-by-play
Since this shot data uses a different coordinate system, I had to convert the shot locations to use the same coordinate system the tracking data uses.
Pre-Processing the Data
While the tracking data from the goal visualizations uses a coordinate system where the rink is about 2400x1015 units, the shot locations from the API are given in feet. Also, the y-axis is flipped between the two. So I converted the shot location coordinates by flipping the y-axis and converting to the tracking data’s coordinate system.
Another part of pre-processing the data is finding the original shot location for tips and deflections. In the play-by-play API data, tip and deflection goal locations are recorded where the tip or deflection happened. I wanted to use the location of the original shot when calculating lateral puck movement to avoid counting the shot’s lateral movement. That meant I had to find the original shot using the tracking data. For each tip and deflection goal, I went backward through the tracking data, starting at the end, to see if the puck either changed direction above a threshold or changed speed above a separate threshold. The rationale being a puck shouldn’t change direction or speed too much directly after being shot.
Here is one example of a deflection goal:
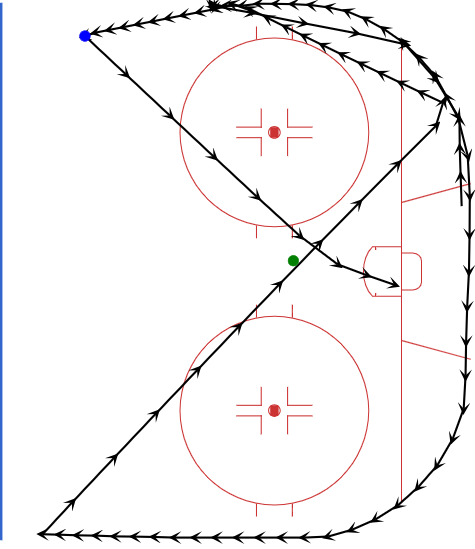
The green dot is the location of the tip, and the blue dot is the estimated location of the original shot. The green dot doesn’t line up with the puck tracking data, shown as the black lines, because the play-by-play data uses a coarser coordinate grid.
I checked the original shot location logic by looking at a dozen or so deflection goals and adjusted the direction and speed thresholds as needed.
Since the coordinate system used by the play-by-play API is coarser than the coordinate system used by the tracking data, I had to also pre-process non-deflection goals to find the location of the original shot in the tracking data.
To do so, I looked for the spot in the tracking data closest to the location given by the play-by-play data that fell under a distance threshold. Using a distance threshold helped filter out goals where the tracking data didn’t match the goal. For example, this goal by Brandt Clarke against the Golden Knights on October 8, 2025 has tracking data where the last part is incorrect. I excluded the goals where the tracking data and the play-by-play’s shot location were too far apart.
Results
With the shot locations found in the tracking data, I then calculated the lateral puck movement before the shots for the 2025-2026 regular season goals. Empty-net goals were omitted. I tried looking at windows of different lengths of time before the shot.
Below are histograms of the amount of lateral puck movement before goals:
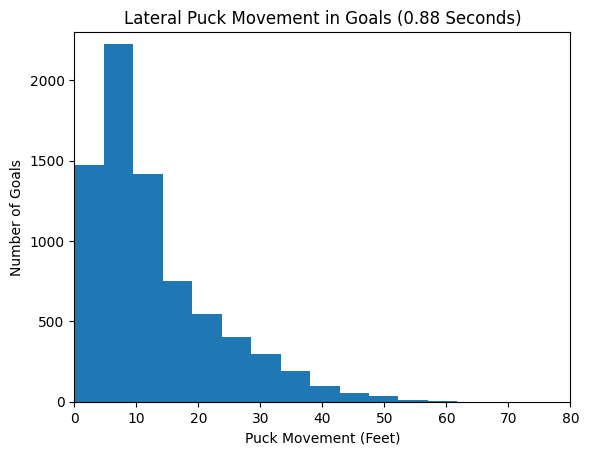
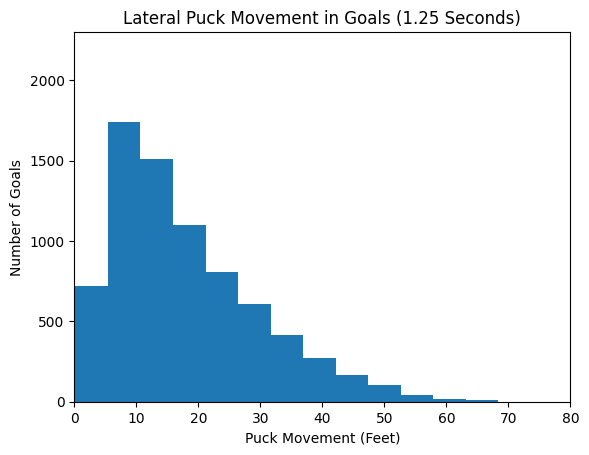
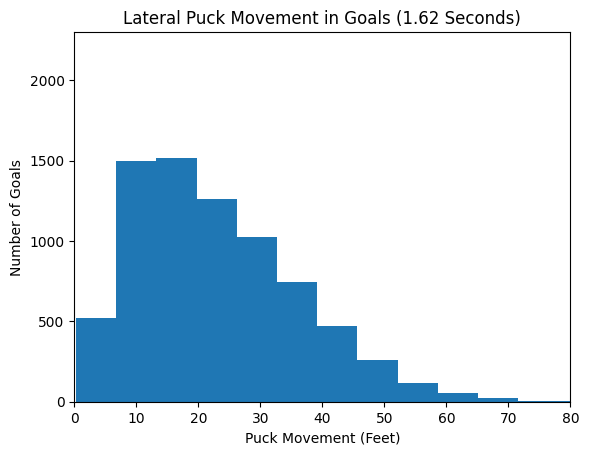
Unsurprisingly, as the time window before the shot increases, the amount of lateral puck movement increases as well.
The median and mean amounts of lateral puck movement:
| Seconds before Goal | Median Lateral Puck Movement (Feet) | Mean Lateral Puck Movement (Feet) |
|---|---|---|
| 0.88 | 9.70 | 12.77 |
| 1.25 | 15.08 | 17.93 |
| 1.62 | 20.65 | 22.97 |
Example Goals
An example of a goal that has 4 feet of lateral puck movement in the 1.25 seconds before the goal:
Jesper Boqvist against the Blackhawks on October 7, 2025
An example of a goal that has 15 feet of lateral puck movement in the 1.25 seconds before the goal:
Nick Schmaltz against the Jets on April 14, 2026
An example of a goal that has 65 feet of lateral puck movement in the 1.25 seconds before the goal:
Matt Boldy against the Mammoth on February 27, 2026
Conclusion
I was expecting goals to have more lateral puck movement than they actually do since I often heard how moving the puck east-to-west is an effective way to score goals. Perhaps I just have a bad sense of scale.
One follow-up analysis I might do in the future is to see how much vertical puck movement there is before goals.