Clustering Winnipeg 24-25 Power Play Goals
Introduction
I was interested in seeing if I could cluster NHL goals using goal tracking data. Clustering is a technique to group similar items together. For a first experiment, I decided to look at a team’s power play goals since that is a smaller number of goals to work with and because I thought there were be more similar plays on the power play.
So I took a look at Winnipeg’s 2024-2025 power play goals since they had the number one power play last regular season.
Data
Last season, the Winnipeg Jets had 62 regulation power play goals and one in overtime. I focused on just the regulation power play goals. To get the game and goal id’s of their power play goals, I used the NHL’s API as documented by Zmalski. Specifically, I used the club schedule season and game landing endpoints.
I already had the 24-25 regular season goal tracking data downloaded, so I could just use the game and goal id’s of the Jets power play goals to filter the tracking data to just those goals.
Then I encoded the goal tracking data into vectors using the approach I took to find similar goals. If you’re interested in the details, check out the repo. This encoding only uses the puck tracking data, not the player tracking data.
Results
The resulting clusters frequently have mostly similar goals. However, there are some clusters where the goals are pretty different from each other. In all, 22 clusters were found. Below is a graph of the cluster sizes:
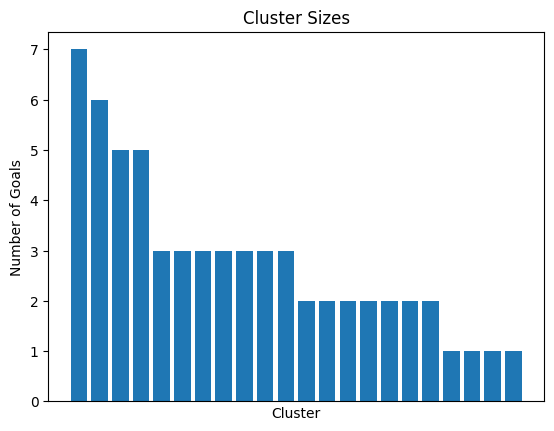
Each bar represents one cluster.
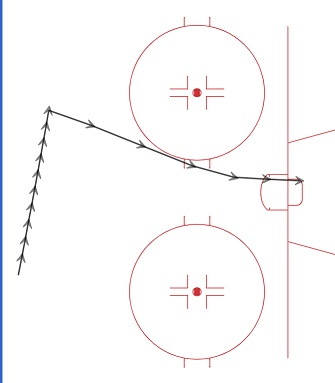
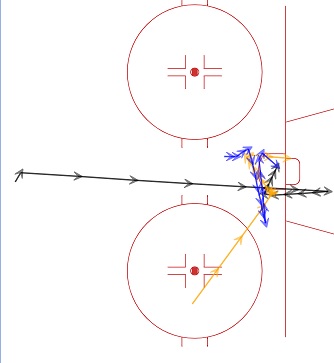
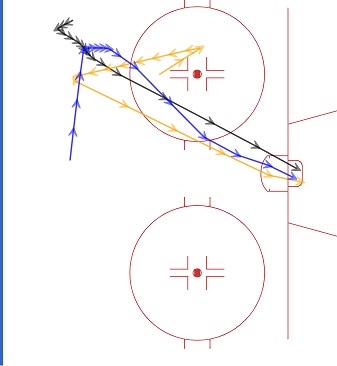
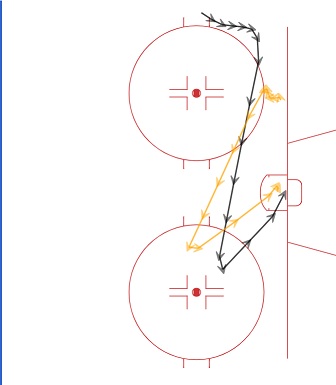
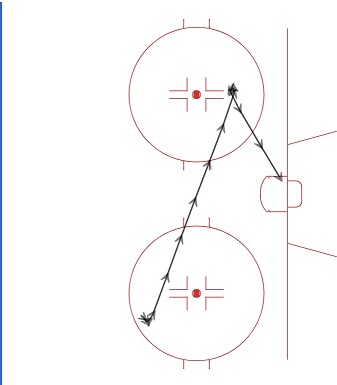
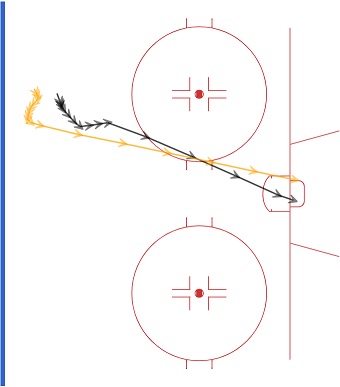
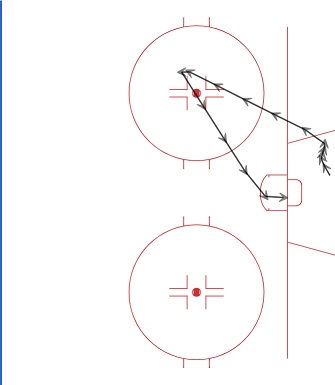
Here is a visualization of the biggest cluster found, which had seven goals:
The lines are the paths the puck took, and the arrows show the direction the puck headed in. Arrows that are farther apart show the puck moving faster.
With many goals shown, it’s a little cluttered, but it’s possible to see the puck moving from the dot to near the goal line. In some goals, a Winnipeg player passes to the slot, while in others, the Jet player attacks the net from the goal line. One goal that differs from the others is the goal shown in blue, which is Scheifele’s goal against the Sharks.
Update: I made a follow-up post that searched for power play goals similar to the first four goals in this cluster.
Links to replays of the goals in this cluster:
- Mar 11, 25: Gabriel Vilardi against the Rangers
- Dec 20, 24: Gabriel Vilardi against the Predators
- Jan 14, 25: Mark Scheifele against the Canucks
- Nov 3, 24: Alex Iafallo against the Lightning
- Mar 4, 25: Nikolaj Ehlers against the Islanders
- Mar 23, 25: Nino Niederreiter against the Sabres
- Dec 17, 24: Mark Scheifele against the Sharks
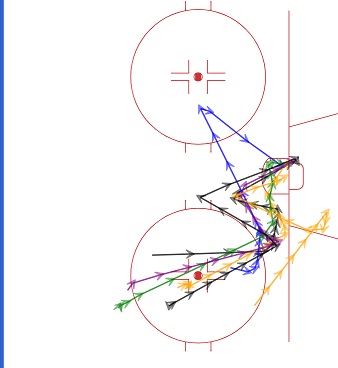
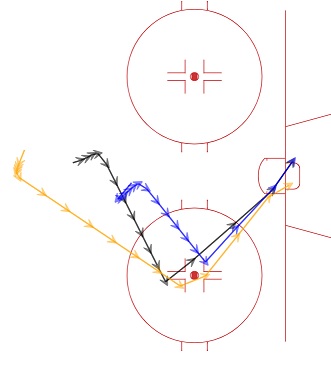
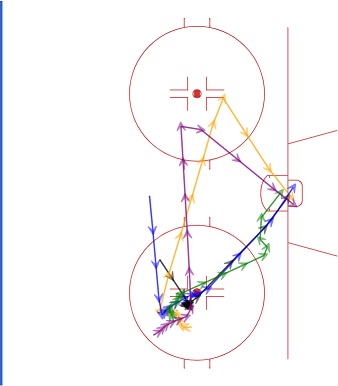
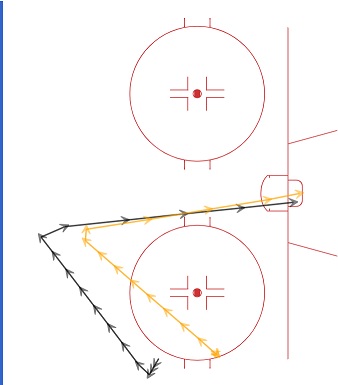
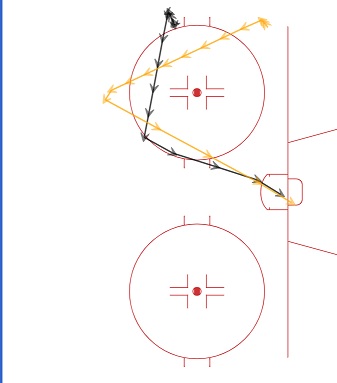
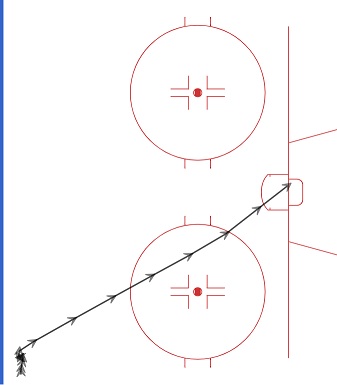
Here is a visualization for the second biggest cluster, which had six goals:
Most of the goals in this group come off a rebound. However, Vilardi’s goal against the Flames and Ehlers’s against the Sharks aren’t. The Ehlers goal, in blue, especially stands out as being different against the others.
Links to replays of the goals in this cluster:
- Nov 27, 24: Gabriel Vilardi against the Kings
- Feb 1, 25: Cole Perfetti against the Capitals
- Apr 5, 25: Mark Scheifele against Utah
- Apr 13, 25: Alex Iafallo against the Oilers
- Jan 26: 25: Gabriel Vilardi against the Flames
- Oct 18, 24: Nikolaj Ehlers against the Sharks
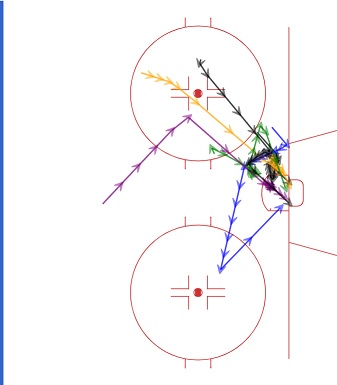
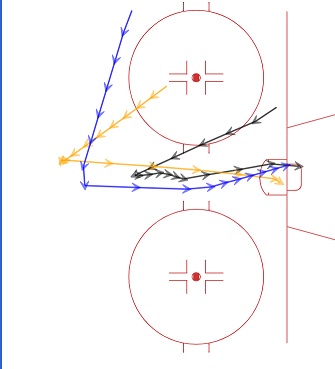
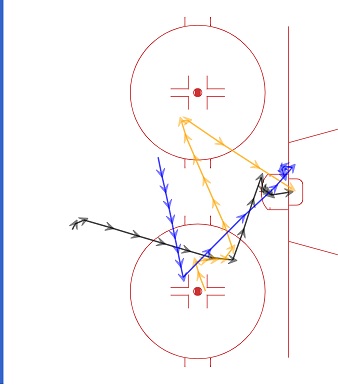
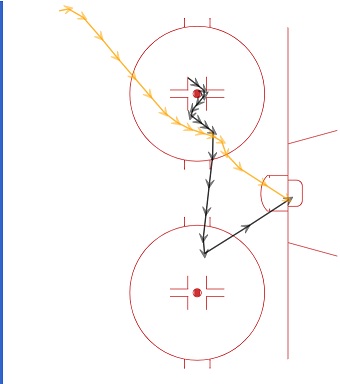
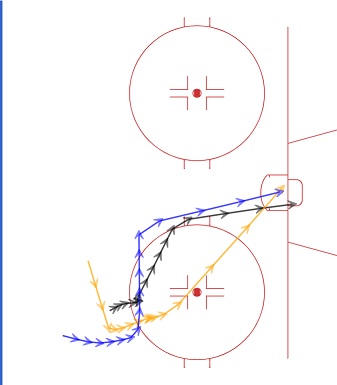
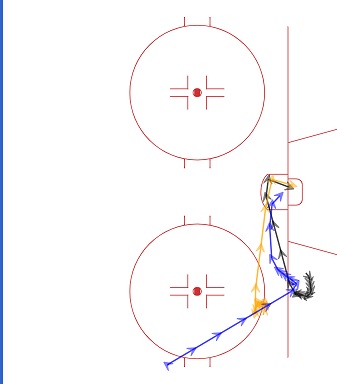
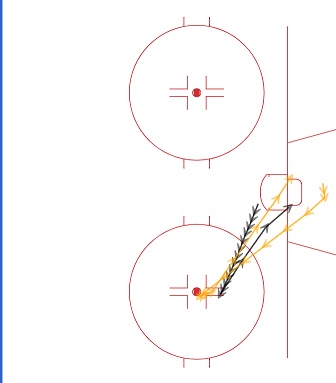
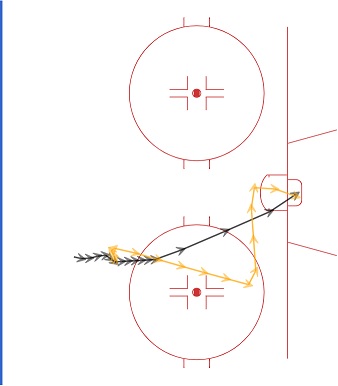
Below is one example of a smaller cluster that has dissimilar goals:
None of the goals in this cluster are particularly similar to each other, showing that the clustering doesn’t always produce great results.
Links to replays of the goals in this cluster:
- Dec 10, 24: Vladislav Namestnikov against the Bruins
- Jan 30, 25: Vladislav Namestnikov against the Bruins
- Nov 12, 24: Gabriel Vilardi against the Rangers
To check out the goals in the other clusters, please take a look at the appendix.
Approach
In order to cluster the power play goals, I had to first create vector representations for them. To do so, I used hyperdimensional computing, which uses high-dimensional random vectors to represent data. You can find more details on this vector representation of goals here. The repo also has the code to create those representations.
One slight tweak I had to make here is to use just the last 17 instances of each goal’s tracking data. During some early experiments, I noticed that the earlier instances in the tracking data were throwing off the results. Most goals had around 90-100 instances in their tracking data after trimming some instances to account for things like data before faceoffs or data after the puck enters the net.
I tried several different numbers of instances to take from the end of the data: 10, 15, 17, and 20, with 17 working the best.
For the clustering algorithm itself, I chose to use agglomerative clustering. One main reason is because I didn’t want to force goals that were dissimilar from all the other goals into a cluster. Agglomerative clustering starts with each goal in its own cluster. Similar clusters then get combined into bigger ones.
Since I used agglomerative clustering, I had to choose the linkage used. The linkage determines how clusters get combined into bigger ones. I tried single, complete, and average linkages, with complete ending up doing the best. Complete linkage looks at two clusters and then takes all the possible pairs where one goal is from one cluster and one is from the other. The distance between these two clusters is defined as the largest distance between two goals in those pairs. Then the two clusters with the smallest distance between them gets merged if that distance falls under a threshold. After trying several different thresholds, I found that a threshold of 0.3 worked the best. For details on the other linkages, refer to this page.
To perform clustering, I used Scikit-Learn’s implementation. For those unfamiliar, Scikit-Learn is a Python machine learning library. You can find the Python script I wrote for clustering here. If you run the clustering, you may end up with slightly different results due to the randomness used when encoding goals as vectors.
Appendix
Here are all the clusters found by running clustering on Winnipeg’s 2024-2025 regular season regulation power play goals. Note that the cluster labels are arbitrary.
Cluster 0
- https://www.nhl.com/ppt-replay/goal/2024020143/696
- https://www.nhl.com/ppt-replay/goal/2024020073/971
- https://www.nhl.com/ppt-replay/goal/2024020482/658
Cluster 1
- https://www.nhl.com/ppt-replay/goal/2024021031/576
- https://www.nhl.com/ppt-replay/goal/2024020978/1018
- https://www.nhl.com/ppt-replay/goal/2024020506/657
- https://www.nhl.com/ppt-replay/goal/2024021119/524
- https://www.nhl.com/ppt-replay/goal/2024020587/1063
- https://www.nhl.com/ppt-replay/goal/2024020702/791
- https://www.nhl.com/ppt-replay/goal/2024020186/885
Cluster 2
- https://www.nhl.com/ppt-replay/goal/2024020073/941
- https://www.nhl.com/ppt-replay/goal/2024020342/1178
- https://www.nhl.com/ppt-replay/goal/2024020978/678
Cluster 3
- https://www.nhl.com/ppt-replay/goal/2024020991/67
- https://www.nhl.com/ppt-replay/goal/2024020716/670
- https://www.nhl.com/ppt-replay/goal/2024020997/529
- https://www.nhl.com/ppt-replay/goal/2024021156/698
- https://www.nhl.com/ppt-replay/goal/2024020991/214
Cluster 4
- https://www.nhl.com/ppt-replay/goal/2024020156/946
- https://www.nhl.com/ppt-replay/goal/2024020201/812
- https://www.nhl.com/ppt-replay/goal/2024020008/1090
Cluster 5
- https://www.nhl.com/ppt-replay/goal/2024020439/679
- https://www.nhl.com/ppt-replay/goal/2024020297/792
- https://www.nhl.com/ppt-replay/goal/2024020506/939
- https://www.nhl.com/ppt-replay/goal/2024020536/188
- https://www.nhl.com/ppt-replay/goal/2024020452/652
Cluster 6
- https://www.nhl.com/ppt-replay/goal/2024020511/614
- https://www.nhl.com/ppt-replay/goal/2024020667/981
- https://www.nhl.com/ppt-replay/goal/2024020587/1076
Cluster 7
- https://www.nhl.com/ppt-replay/goal/2024020852/464
- https://www.nhl.com/ppt-replay/goal/2024020812/795
Cluster 8
- https://www.nhl.com/ppt-replay/goal/2024020775/453
- https://www.nhl.com/ppt-replay/goal/2024020410/601
Cluster 9
- https://www.nhl.com/ppt-replay/goal/2024020536/558
- https://www.nhl.com/ppt-replay/goal/2024021204/711
Cluster 10
- https://www.nhl.com/ppt-replay/goal/2024020316/828
- https://www.nhl.com/ppt-replay/goal/2024020008/651
- https://www.nhl.com/ppt-replay/goal/2024020791/950
Cluster 11
- https://www.nhl.com/ppt-replay/goal/2024020230/205
- https://www.nhl.com/ppt-replay/goal/2024020482/403
- https://www.nhl.com/ppt-replay/goal/2024020129/132
Cluster 12
Cluster 13
- https://www.nhl.com/ppt-replay/goal/2024021271/596
- https://www.nhl.com/ppt-replay/goal/2024020073/423
Cluster 14
- https://www.nhl.com/ppt-replay/goal/2024020230/646
- https://www.nhl.com/ppt-replay/goal/2024020171/1006
Cluster 15
- https://www.nhl.com/ppt-replay/goal/2024020546/373
- https://www.nhl.com/ppt-replay/goal/2024020129/1088
Cluster 16
- https://www.nhl.com/ppt-replay/goal/2024020452/402
- https://www.nhl.com/ppt-replay/goal/2024020812/81
- https://www.nhl.com/ppt-replay/goal/2024020247/727
Cluster 17
Cluster 18
- https://www.nhl.com/ppt-replay/goal/2024020359/82
- https://www.nhl.com/ppt-replay/goal/2024020831/315
- https://www.nhl.com/ppt-replay/goal/2024020073/320
- https://www.nhl.com/ppt-replay/goal/2024021219/864
- https://www.nhl.com/ppt-replay/goal/2024021282/584
- https://www.nhl.com/ppt-replay/goal/2024020791/903
Cluster 19
Cluster 20
- https://www.nhl.com/ppt-replay/goal/2024020852/569
- https://www.nhl.com/ppt-replay/goal/2024020574/908
Cluster 21