Follow-Up to 24-25 Winnipeg Jets Power Play Goals: Finding Goals That Follow the Same Play
Introduction
After writing the previous post about clustering 24-25 Winnipeg Jets power play goals, I saw a Dallas power play goal that was similar to the largest cluster of Jets power play goals.
That made me wonder how common this kind of power play goal is, where the puck gets moved from the half-wall to the goal line and then to the slot. So I did a quick analysis to find those kinds of goals in the 24-25 season.
Results
The Winnipeg power play goals I wanted to find similar goals for are:
- Mar 11, 25: Gabriel Vilardi against the Rangers
- Dec 30, 24: Gabriel Vilardi against the Predators
- Jan 14, 25: Mark Scheifele against the Canucks
- Nov 3, 24: Alex Iafallo against the Lightning
I was able to find 13 power play goals from the past season similar to the Winnipeg goals:
- FLA Jan 8, 25: Sam Reinhart against Utah
- DET Jan 12, 25: Dylan Larkin against the Kraken
- TOR Mar 8, 25: John Tavares against the Avalanche
- VAN Oct 9, 24: Brock Boeser against the Flames
- PIT Apr 6, 25: Rickard Rakell against the Blackhawks
- PIT Nov 19, 24: Rickard Rakell against the Lightning
- DAL Dec 16, 24: Roope Hintz against the Capitals
- NJD Feb 23, 25: Stefan Noesen against the Predators
- TBL Dec 17, 24: Mitchell Chaffee against the Blue Jackets
- PHI Oct 12, 24: Travis Konecny against the Flames
- DAL Apr 12, 25: Wyatt Johnston against Utah
- WSH Nov 29, 24: Tom Wilson against the Islanders
- DET Mar 25, 25: J.T. Compher against the Avalanche
Approach
To find power play goals similar to the Winnipeg ones, I used the same hyperdimensional computing encodings of the goal tracking data used to cluster Winnipeg power play goals.
That let me sort goals by similarity to the Winnipeg goals.
Then I used the NHL API to filter on just the power play goals.
After that, I manually reviewed a handful goals to set a similarity threshold, and those that met that threshold were all reviewed.
In all, I reviewed around 30 or so goals.
You can find a reference for the NHL API here.
Example Python code:
from dataclasses import dataclass
import json
import polars as pl
import numpy as np
import requests

@dataclass
class Goal:
    game: int
    goal: int

@dataclass
class GoalDist:
    game_id: int
    goal_id: int
    dist: float


def dist(x: np.ndarray, y: np.ndarray) -> float:
    """
    Calculates the distance between 2 binary hypervectors

    PARAMETERS:
        - x (numpy array): binary hypervector of shape (d,)
        - y (numpy array): binary hypervector of shape (d,)

    RETURNS:
        - dist (float): Hamming distance between x and y
    """
    if x.shape != y.shape:
        raise ValueError(f'x and y have different dimensions: {x.shape} and {y.shape}')

    dim = x.shape[0]
    return np.count_nonzero(x!=y)/dim


# read in exported goal hypervectors that have been created by trimming
# the tracking data to the last 17 instances
df_goal_hvs_last_17 = pl.read_parquet('goal_hvs.parquet')

# sort goals by similarity to this Winnipeg one
specified_game_id = 2024020587
specified_goal_id = 1063

specified_goal_hv = df_goal_hvs_last_17.filter(
    (pl.col('game_id')==specified_game_id) &
    (pl.col('goal_id')==specified_goal_id)
).select(
    pl.col('goal_hv')
).to_series().to_list()[0]
specified_goal_hv = np.array(specified_goal_hv)

goal_dists = []

for row in df_goal_hvs_last_17.filter(
    (pl.col('game_id')!=specified_game_id) &
    (pl.col('goal_id')!=specified_goal_id)
).rows(named=True):
    other_game_id = row['game_id']
    other_goal_id = row['goal_id']
    other_goal_hv = np.array(row['goal_hv'])

    goal_dist = dist(specified_goal_hv, other_goal_hv)

    goal_dists.append(GoalDist(game_id=other_game_id, goal_id=other_goal_id, dist=goal_dist))

l_sim_goals = sorted(goal_dists, key=lambda item: item.dist)

# print out info for the most similar ones
NUM_PDS = 3

threshold = 0.141

for goal_dist in l_sim_goals:
    if (goal_dist.dist <= threshold):
        r = requests.get(f'https://api-web.nhle.com/v1/gamecenter/{goal_dist.game_id}/landing')
        landing_str = r.content.decode()
        dict_landing = json.loads(landing_str)

        for i in range(NUM_PDS): # ignoring OT pp goals
            l_dict_goals = dict_landing['summary']['scoring'][i]['goals']

            # go through each goal in the game to find the similar one
            for dict_goal in l_dict_goals:
                event_id = dict_goal['eventId']
                strength = dict_goal['strength']
                scoring_team = dict_goal['teamAbbrev']['default']

                if (strength == 'pp') and (event_id == goal_dist.goal_id):
                    print(f'Team: {scoring_team}')
                    url = f'https://www.nhl.com/ppt-replay/goal/{goal_dist.game_id}/{goal_dist.goal_id}'
                    print(f'Game: {goal_dist.game_id}, goal: {goal_dist.goal_id}, dist: {goal_dist.dist}, url: {url}')
Here is a visualization of the paths the puck took in the similar goals:
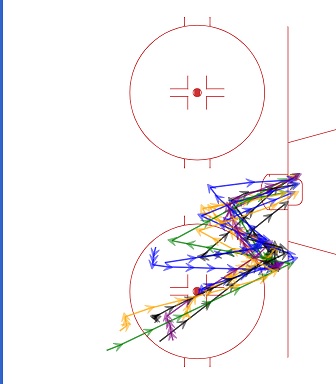
Each separate line represents a different goal. The arrows show the direction the puck moves in. The large overlap between the different goals highlights the similarity between the goals.
Conclusion
When the question, “How common are power play goals like this one?” popped into my head, the goal encodings I created using the tracking data made it simple to find out. They helped narrow down the goals I had to review to just a few dozen goals.